
Food & Beverage
Locations · Food Costs · Suppliers
A busy location can still put pressure on cash.
Sales can move quickly while food and input costs, payroll, rent, equipment, and other commitments follow different timing. See each location and the group position before the next commitment becomes fixed.
Food & Hospitality financial reality
Sales and operating commitments need to be read together.
Demand, covers or orders, service, sales, and settlement form one path. Food and input costs, labor, rent, equipment, and recurring commitments create another. Both meet in the location financial position.
Revenue path
Financial timing, not POS activity
- 01
Demand / bookings / orders
The service period begins with demand
- 02
Covers / orders served
Activity turns into completed service
- 03
Sales
Recorded revenue enters the financial picture
- 04
Payment settlement
Timing still separates sales from cash
- 05
Cash
Settled receipts reach the financial position
Parallel cost path
Commitments continue
- C1
Food / inputs
Perishable purchases and supplier timing
- C2
Labor
Payroll and staffing commitments
- C3
Rent
Occupancy cost stays on schedule
- C4
Equipment
Financing and service commitments
- C5
Recurring commitments
Other known obligations
Location financial position
Read sales and operating commitments together.
A busy service period can still create pressure when settlement timing and fixed commitments move differently.
Location economics
A busy location can still put pressure on cash.
Read sales beside labor, input cost, occupancy, equipment, and settlement timing. The group picture matters, but so does which location is creating the pressure.
Illustrative location economics
The group number should not hide the local question.
illustrative, no benchmark
Location A
01- Sales
- Strong sales
- Commitment pressure
- Higher labor and input pressure
- Decision question
- Is growth creating cash?
Location B
02- Sales
- Stable sales
- Commitment pressure
- Stable operating commitments
- Decision question
- Does the current plan still hold?
Location C
03- Sales
- Softer sales
- Commitment pressure
- High fixed-cost pressure
- Decision question
- What needs to change?
Perishable-input planning
Turn demand movement into the next purchasing assumption.
Compare planned demand with recorded activity and keep the input commitment visible. The user decides what the variance means for the next purchasing assumption.
- 01
Planned demand
The expected service level guides the purchasing assumption
- 02
Input commitment
Perishable inputs and supplier spend become cash pressure
- 03
Actual demand
Recorded activity shows what really happened
- 04
Variance
The difference stays visible without an automatic explanation
- 05
Next purchasing assumption
The user decides what should change next
Plan & decide
Find the drift before changing the location plan.
Compare the plan with the recorded result. Keep variance visible, then review sales assumptions, food cost, labor, supplier timing, or the next commitment.
Plan vs actual
Turn location variance into a decision.
Review sales, food cost, and labor before deciding.
- Plan
Approved assumptions
- Actual
Recorded period
- Variance
Difference retained
- Next action
Review and decide
Sales
- Plan
- Approved sales assumption
- Actual
- Recorded period result
- Variance
- Difference retained
- Next action
- Review Covers or Average Check assumptions
- Status
- Review movement
Food cost
- Plan
- Approved food cost budget
- Actual
- Recorded period spend
- Variance
- Difference retained
- Next action
- Review spend and supplier timing
- Status
- Review pressure
Labor
- Plan
- Approved labor budget
- Actual
- Recorded staff cost
- Variance
- Difference retained
- Next action
- Review staffing against demand
- Status
- Review timing
Scenarios
Test the next assumption before it becomes a commitment.
Explore fewer Covers, a lower Average Check, higher food or labor cost, an equipment purchase, or another location. These are questions, not presets.
Illustrative decisions
- 01
Fewer Covers
What changes when guest volume falls below the current plan?
- 02
Lower Average Check
How does a different spend assumption affect Modeled Revenue?
- 03
Higher food or labor cost
What happens when operating pressure rises faster than sales?
- 04
Another location
Can the financial plan carry added rent, staff, and commitments?
Examples only, not Food & Beverage-specific scenario presets or recommendations.
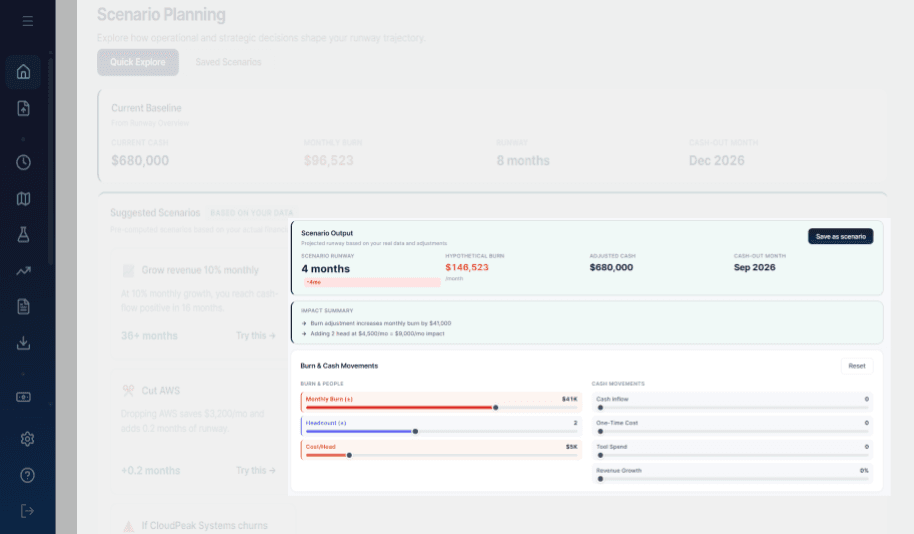
Inside RunwayCal · Scenarios
The visible product supports changing assumptions and comparing runway, burn, cash, and cash-out timing against a baseline.
Multi-location product proof
See the group without losing each location.
Mission Control holds the primary financial view. Multi-location evidence keeps separate organizations visible inside the combined context without claiming restaurant operations software.
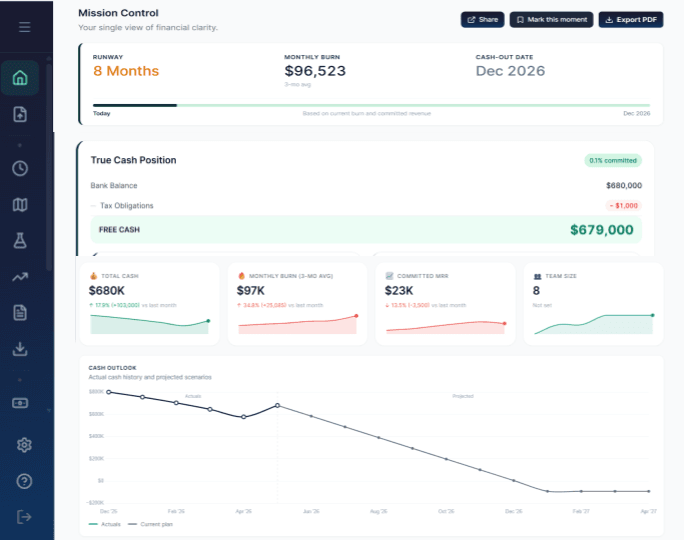
Primary product view · Mission Control
Start with the complete financial position.
The visible product brings runway, monthly burn, cash-out date, True Cash Position, and financial summary context together. It is general product evidence, not a restaurant dashboard.
Conceptual multi-location relationship
Keep local context inside the group view.
The product supports separate organizations with consolidated financial context. The relationship shown here is explanatory, not a RunwayCal screen.
Separate locations · shared decision context
Location A
Sales and cost pressure remain visible
Location B
Stable trading remains visible
Location C
Fixed-cost pressure remains visible
Combined financial context
Read the group position without losing the location behind the pressure.
Reporting & metrics
Use each number to ask a better location question.
Give owners, operators, and finance leads the context behind sales, cost pressure, commitments, and cash.
Explore reporting- True Cash Position
- Decision question: How do held cash and recorded obligations relate?
- Visible in product
- Sales and demand
- Decision question: Did recorded activity differ from the approved plan?
- Recorded vs plan
- Labor
- Decision question: Did people cost move ahead of demand?
- Planning context
- Input cost
- Decision question: Did food and supplier pressure move above the assumption?
- Planning context
- Settlement timing
- Decision question: When did recorded sales become received cash?
- User-reviewed
- Location context
- Decision question: Which location is creating pressure inside the group picture?
- Multi-location context
Only True Cash Position is presented as a directly visible product measure here. Other labels are planning context, not POS, reservation, kitchen, inventory, or workforce-scheduling calculations.
Keep planning
Take the location question into the right planning view.
Move from demand, input and labor pressure, settlement timing, and location context into the financial decision that needs review.
Plan the next location decision without losing sight of cash.
Connect demand, sales, settlement timing, labor, inputs, rent, equipment, and commitments before the next move becomes fixed.