MRR, runway, and cash exposure in one operational system.
SaaS companies live and die by MRR, churn, and burn rate. Your financial model is subscription-based, your costs are front-loaded, and your revenue recognition is complex. RunwayCal is built for this model: MRR waterfall tracking, cohort retention curves, burn multiple analysis, and runway computation from confirmed recurring revenue.
- Stripe auto-sync
- MRR tracking
- 23 insight rules
- Board viewer
- Scenario modeling
The financial challenges SaaS operators face daily.
MRR is not revenue until it is collected
Your CRM says $50K MRR. But how much of that is actually collected? RunwayCal tracks committed MRR separately from confirmed receipts. The collection rate shows the gap between what customers promised and what they paid. That gap is the difference between your projected runway and your real runway.
Burn rate hides in payroll concentration
SaaS companies typically run 70-85% payroll as a percentage of burn. That is expected, but it means small team changes have outsized impact on runway. Adding one senior engineer can cost 2 months of runway. RunwayCal's burn composition breakdown shows exactly how concentrated your costs are and what happens if you adjust.
Growth masks cash flow problems
Revenue growing 15% monthly feels great until you realize you are spending 4x what you earn to achieve it. Burn multiple (burn divided by net new revenue) tells you whether your growth is efficient or unsustainable. RunwayCal computes burn multiple automatically and flags when it exceeds healthy thresholds for your stage.
Board reporting is quarterly, but decisions are daily
Your board meets every quarter, but hiring and spending decisions happen every week. You need a financial dashboard that is current today, not a deck that reflects last quarter. RunwayCal's Mission Control updates every time you log in, and the board deck generates from live data in one click.
Stripe says
MRR
$45,000
Annual prepayments
+$120,000
Total recognized
$165,000
Your bank says
Cash received
$38,200
Actually deposited
$38,200
Built for subscription-based financial operations.
MRR waterfall and cohort retention
Track new, expansion, contraction, and churned MRR in a visual waterfall. See which months are net-positive and which are net-negative. Cohort retention curves show how long customers stay and where the drop-off happens. Seasonal acquisition index adjusts your growth projections for months when signups naturally spike or dip. Build a 36-month revenue projection grounded in your actual retention and growth data.
Burn multiple and efficiency metrics
Revenue per employee, tools cost per employee, payroll as percentage of burn, and burn multiple. These four ratios tell you whether your SaaS company is operating efficiently relative to its growth. RunwayCal computes them automatically from your team, tools, and revenue data. The CFO View section on Mission Control puts these ratios front and center.
Stripe and CRM integration
Connect Stripe to sync revenue, customers, and subscriptions. Connect HubSpot or Salesforce to sync your pipeline. RunwayCal's suggestion engine matches CRM deals to RunwayCal deals and maps Stripe customers to revenue entries. All read-only. Data flows in, you review and approve.
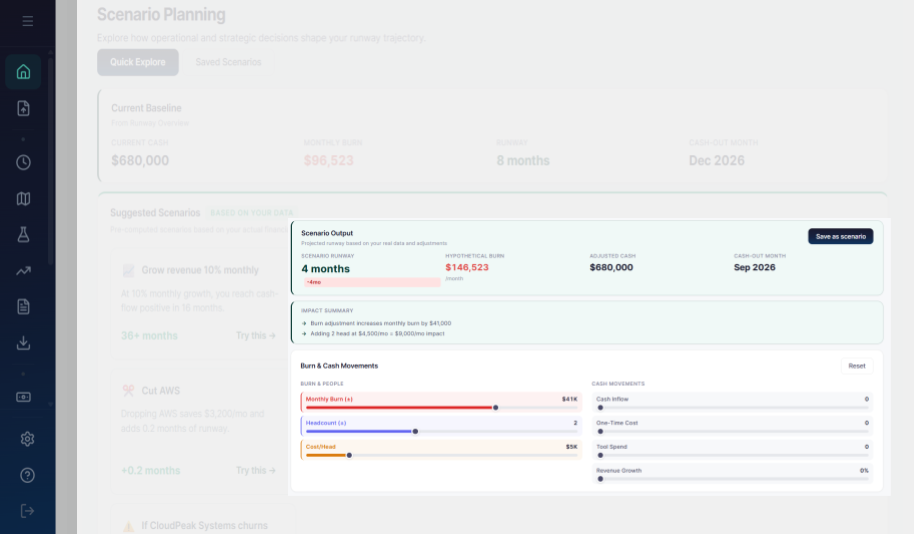
Scenario modeling for SaaS decisions
What if churn increases by 2%? What if you close that enterprise deal? What if you hire a sales team? Model each scenario against your actual data. See the runway impact, burn change, and cash-out date for each path. Compare up to 3 scenarios side by side.
Stripe-connected financial visibility.
Auto-Sync Revenue
Connect your restricted API key. RunwayCal reads customers, subscriptions, charges, and balance automatically. No manual data entry.
Treasury Visibility
Stripe balance synced to your treasury. See Stripe funds alongside bank accounts in one cash view.
Collection Tracking
Overdue invoices, failed charges, and subscription churn surface automatically. Stop discovering missed payments in spreadsheet reconciliation.
Receipt Alignment
Webhooks create receipts on linked deals automatically. Dedup ensures no double-counting. Unmatched events queue for review.
See hiring and growth impact before it happens.
- Hire 2 engineers: +$25K/mo burn, runway drops from 8.2 to 5.4 months
- Lose enterprise customer: -$15K MRR, runway drops by 2.1 months
- Close Series A ($2M): runway extends to 22 months
- Reduce tool spend 20%: runway extends by 0.8 months
Board-ready SaaS financial reporting.
Board Viewer
Secure read-only link. Investors see runway, burn, MRR, efficiency metrics. No account needed. 30-day TTL.
Executive Summary
Auto-generated: what is going well, what is concerning, where help is needed. Editable before sharing.
PDF/PPTX Export
One-click export with burn efficiency, revenue movement, and capital deployment. Formatted for board consumption.
Metrics SaaS operators actually track.
Burn Multiple
Net burn divided by net new ARR. Below 2x is efficient.
MRR Movement
New + expansion minus contraction minus churned. The full revenue picture.
Revenue per Employee
MRR divided by headcount. Measures team efficiency.
Deferred Revenue
Collected but unearned revenue. Reduces True Cash.
Runway Compression
Rate at which true runway is shortening month over month.
True Cash Runway
Available cash after obligations divided by net burn.
Financial visibility should go deeper than MRR dashboards.
Free to start. No credit card required.