
Investor-grade statements from your data.
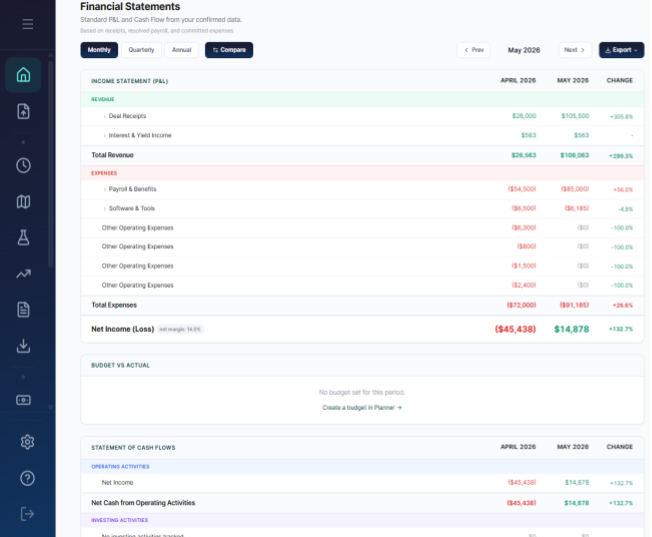
P&L and Cash Flow statements generated automatically from your structured inputs. Budget vs actual tracking with variance analysis. Standard accounting format that your board, accountant, and investors recognize. No assembly required.
- P&L statement
- Cash Flow statement
- Budget vs actual
- Historical comparison
Financial statements without the accounting complexity.
You add your revenue (deals and receipts), your expenses (team salaries, tool subscriptions, cash commitments), and your cash positions (treasury accounts). RunwayCal assembles the Income Statement and Cash Flow Statement automatically. Revenue categorized by source. Expenses categorized by type. Operating, investing, and financing activities separated per accounting standards. The output is a standard financial report, not a custom dashboard pretending to be one.
What gets generated
P&L Clarity
Revenue, COGS, gross margin, operating expenses by category, and net income. Period-over-period comparison shows growth rates and trend direction. Negative net income displayed in red with parentheses following accounting convention. Expandable line items for drill-down to individual transactions.
Cash Flow Visibility
Operating activities (net income adjustments), investing activities, and financing activities. See where cash is coming from and where it is going. Net change in cash reconciles opening and closing balances. The ending cash balance matches your treasury, every time, because both come from the same data.
Budget vs Actual
Set budgets by category: payroll, tools, commitments, revenue. RunwayCal compares actual spend against plan automatically. Variance shown in both dollars and percentage. Severity badges flag categories over budget. Drill down to see which specific expenses caused the variance.
What you get at every tier
| Capability | Free | Pro $29/mo | Growth $149/mo |
|---|---|---|---|
| View statements | upgrade | ||
| Budget tracking | |||
| Variance analysis | |||
| Historical comparison | |||
| Export (PDF/CSV) | upgrade | ||
| Multi-location statements |
Financial reporting should take minutes, not days.
Free to start. No credit card required.
Related terms:P&L·Cash Flow Statement·Budget Variance·EBITDA