Financial visibility for logistics and distribution
Track fleet costs, fuel expenses, and contract payments across routes and warehouses. RunwayCal gives business owners variable cost visibility and consolidated cash position across every location.
- Fuel scenario modeling
- Multi-location consolidation
- Per-contract collections
- Multi-state tax tracking
The challenge
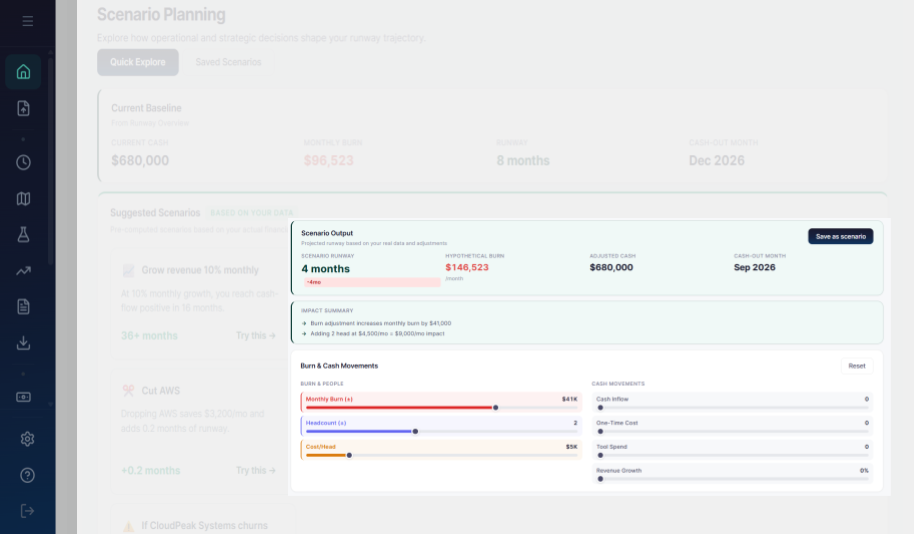
Variable costs make burn rate unpredictable
Fuel costs change weekly. Insurance is quarterly. Vehicle maintenance is unpredictable. Your burn rate is never the same two months in a row. A spreadsheet average from last quarter does not capture a 30% fuel price spike happening right now, and by the time you notice the bank balance drop, payroll is already at risk.
Contract payments arrive on different schedules
Some clients pay per load, some pay monthly, some pay 60 days late. Forecasting cash is guesswork when every contract has different terms and every client has different payment behavior. A strong revenue month on paper can still leave you short for next week's fuel bill.
Multiple locations fragment financial visibility
You operate from four locations with two warehouses. Getting a single view of company finances requires calling three different people. Each location manager knows their own numbers but nobody sees the consolidated cash position without manual assembly at month end.
How RunwayCal helps
Cash commitment tracking for recurring and variable expenses
Insurance premiums, lease payments, and equipment financing appear as scheduled commitments. Variable costs like fuel can be modeled with scenario ranges. RunwayCal shows your baseline burn and lets you stress-test against price changes before they hit your account.
Multi-location financial consolidation
Each terminal, warehouse, and route hub tracks its own costs. The parent dashboard rolls up treasury balances, payroll, and vendor payments into one company-wide view. Business owners check one dashboard instead of assembling reports from four locations.
Collection tracking per client contract
Track payment terms and actual collection speed for each client contract. Per-load, monthly, and Net 60 clients all appear in your receivables pipeline with realistic collection timing. Overdue accounts surface automatically.
Tax obligation tracking across states
Fuel tax, highway use tax, and state-level obligations appear on your tax calendar with scheduled outflows. Multi-state operations no longer mean surprise tax payments that compress runway without warning.
Features that matter for logistics operators
Fuel cost scenario modeling
Model fuel price changes at 10%, 20%, and 30% against your current cash reserves. See the runway impact before you adjust client rates or cut routes.
Fleet maintenance commitments
Scheduled maintenance and repair reserves appear as cash commitments so unexpected shop bills do not surprise you.
Per-route profitability
Compare revenue and direct costs by route or client contract. Identify which lanes generate cash and which drain it.
Payroll across locations
Drivers, warehouse staff, and dispatch teams at each location roll into consolidated payroll burn with per-location breakdown.
When fuel prices spike, visibility beats reaction
A regional freight company with 28 trucks and two warehouses was tracking finances in accounting software but had no visibility into future cash needs. When fuel prices spiked 30% in one quarter, the owner did not see the cash impact until the bank balance dropped below payroll.
RunwayCal's scenario modeling let the owner model fuel price changes against cash reserves and adjust client rates before the shortfall hit. Multi-location consolidation meant terminal managers tracked their own costs while the owner saw company-wide runway updated daily. The business went from reactive cash management to planning fuel surcharges two weeks ahead of the impact.
Metrics logistics operators actually track
Cost per Mile
All-in operating cost divided by miles driven
Fuel Burn %
Fuel costs as share of total monthly burn
Collection Speed
Average days to payment per client contract
Route Margin
Revenue minus direct costs per route or lane
Location Burn Rate
Monthly spend per terminal or warehouse
True Cash Runway
Months of runway after all committed obligations
Model variable costs before they compress runway
Free to start. No credit card required.